Athlete marketing campaigns create strong emotional connections between brands and audiences, but long term success depends on more than visibility alone. Measuring performance allows brands to understand whether an athlete partnership truly delivered value, supported business goals, and justified the investment.
At Mayfield Sports Marketing, we help brands measure, refine, and scale athlete campaigns. With over 15 years of experience as a full service booking agency based in Wisconsin, we work with professional athletes and motivational speakers to ensure each activation is both impactful and accountable.
Why Measurement Matters in Athlete Marketing
Athlete appearances often involve appearance fees, travel, production, and promotional costs. Without clear performance tracking, it becomes difficult to understand what actually worked. Measurement helps brands move beyond assumptions and make data driven decisions.
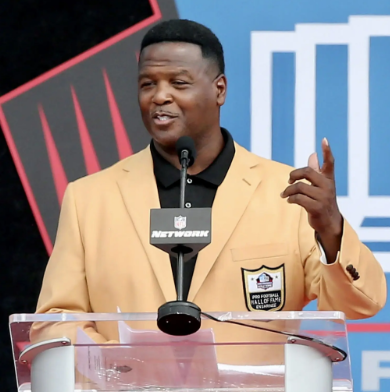
For example, a community focused appearance with a respected former player like John Kuhn may be successful even if it does not drive immediate sales. Meanwhile, a digital campaign featuring a current athlete like Jayden Reed may be evaluated more heavily on engagement, reach, and online conversions. Success looks different depending on the campaign goal.
Setting Clear Goals Before the Campaign Begins
Every effective measurement strategy starts with clear objectives. Some athlete campaigns are designed to build brand awareness, others aim to increase event attendance, social engagement, or lead generation.
When goals are defined early, brands can align metrics accordingly. This prevents confusion later and ensures performance is evaluated fairly. A meet and greet, a social media takeover, and a keynote appearance should not all be measured using the same benchmarks.
Evaluating Social Media and Digital Performance
Social media plays a major role in modern athlete marketing. Campaigns often rely on athlete posts, short form video, and behind the scenes content to connect with fans.
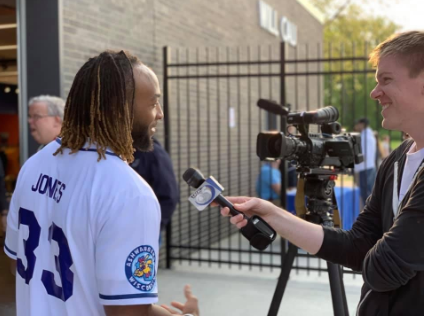
Engagement quality is more important than follower counts alone. Comments, shares, and saves indicate stronger audience interest than likes. Athletes like Romeo Doubs often perform well when content feels authentic rather than overly promotional, which reinforces trust between the athlete, the brand, and the audience.
Tracking link clicks, story interactions, and audience growth during campaign periods helps brands understand digital impact more clearly.
Measuring Website Traffic and Online Behavior
Athlete campaigns frequently drive traffic to brand websites, landing pages, or event sign ups. Monitoring visitor behavior during campaign windows provides insight into how athlete exposure influences interest.
Increases in page views, longer time on site, and improved conversion rates often signal that the athlete partnership resonated. When tracking tools are used properly, brands can identify which athlete driven touchpoints delivered the strongest results.
Assessing In Person Events and Community Impact
Live appearances remain one of the most powerful athlete marketing tools. Measuring attendance, participation, and post event engagement helps quantify impact.
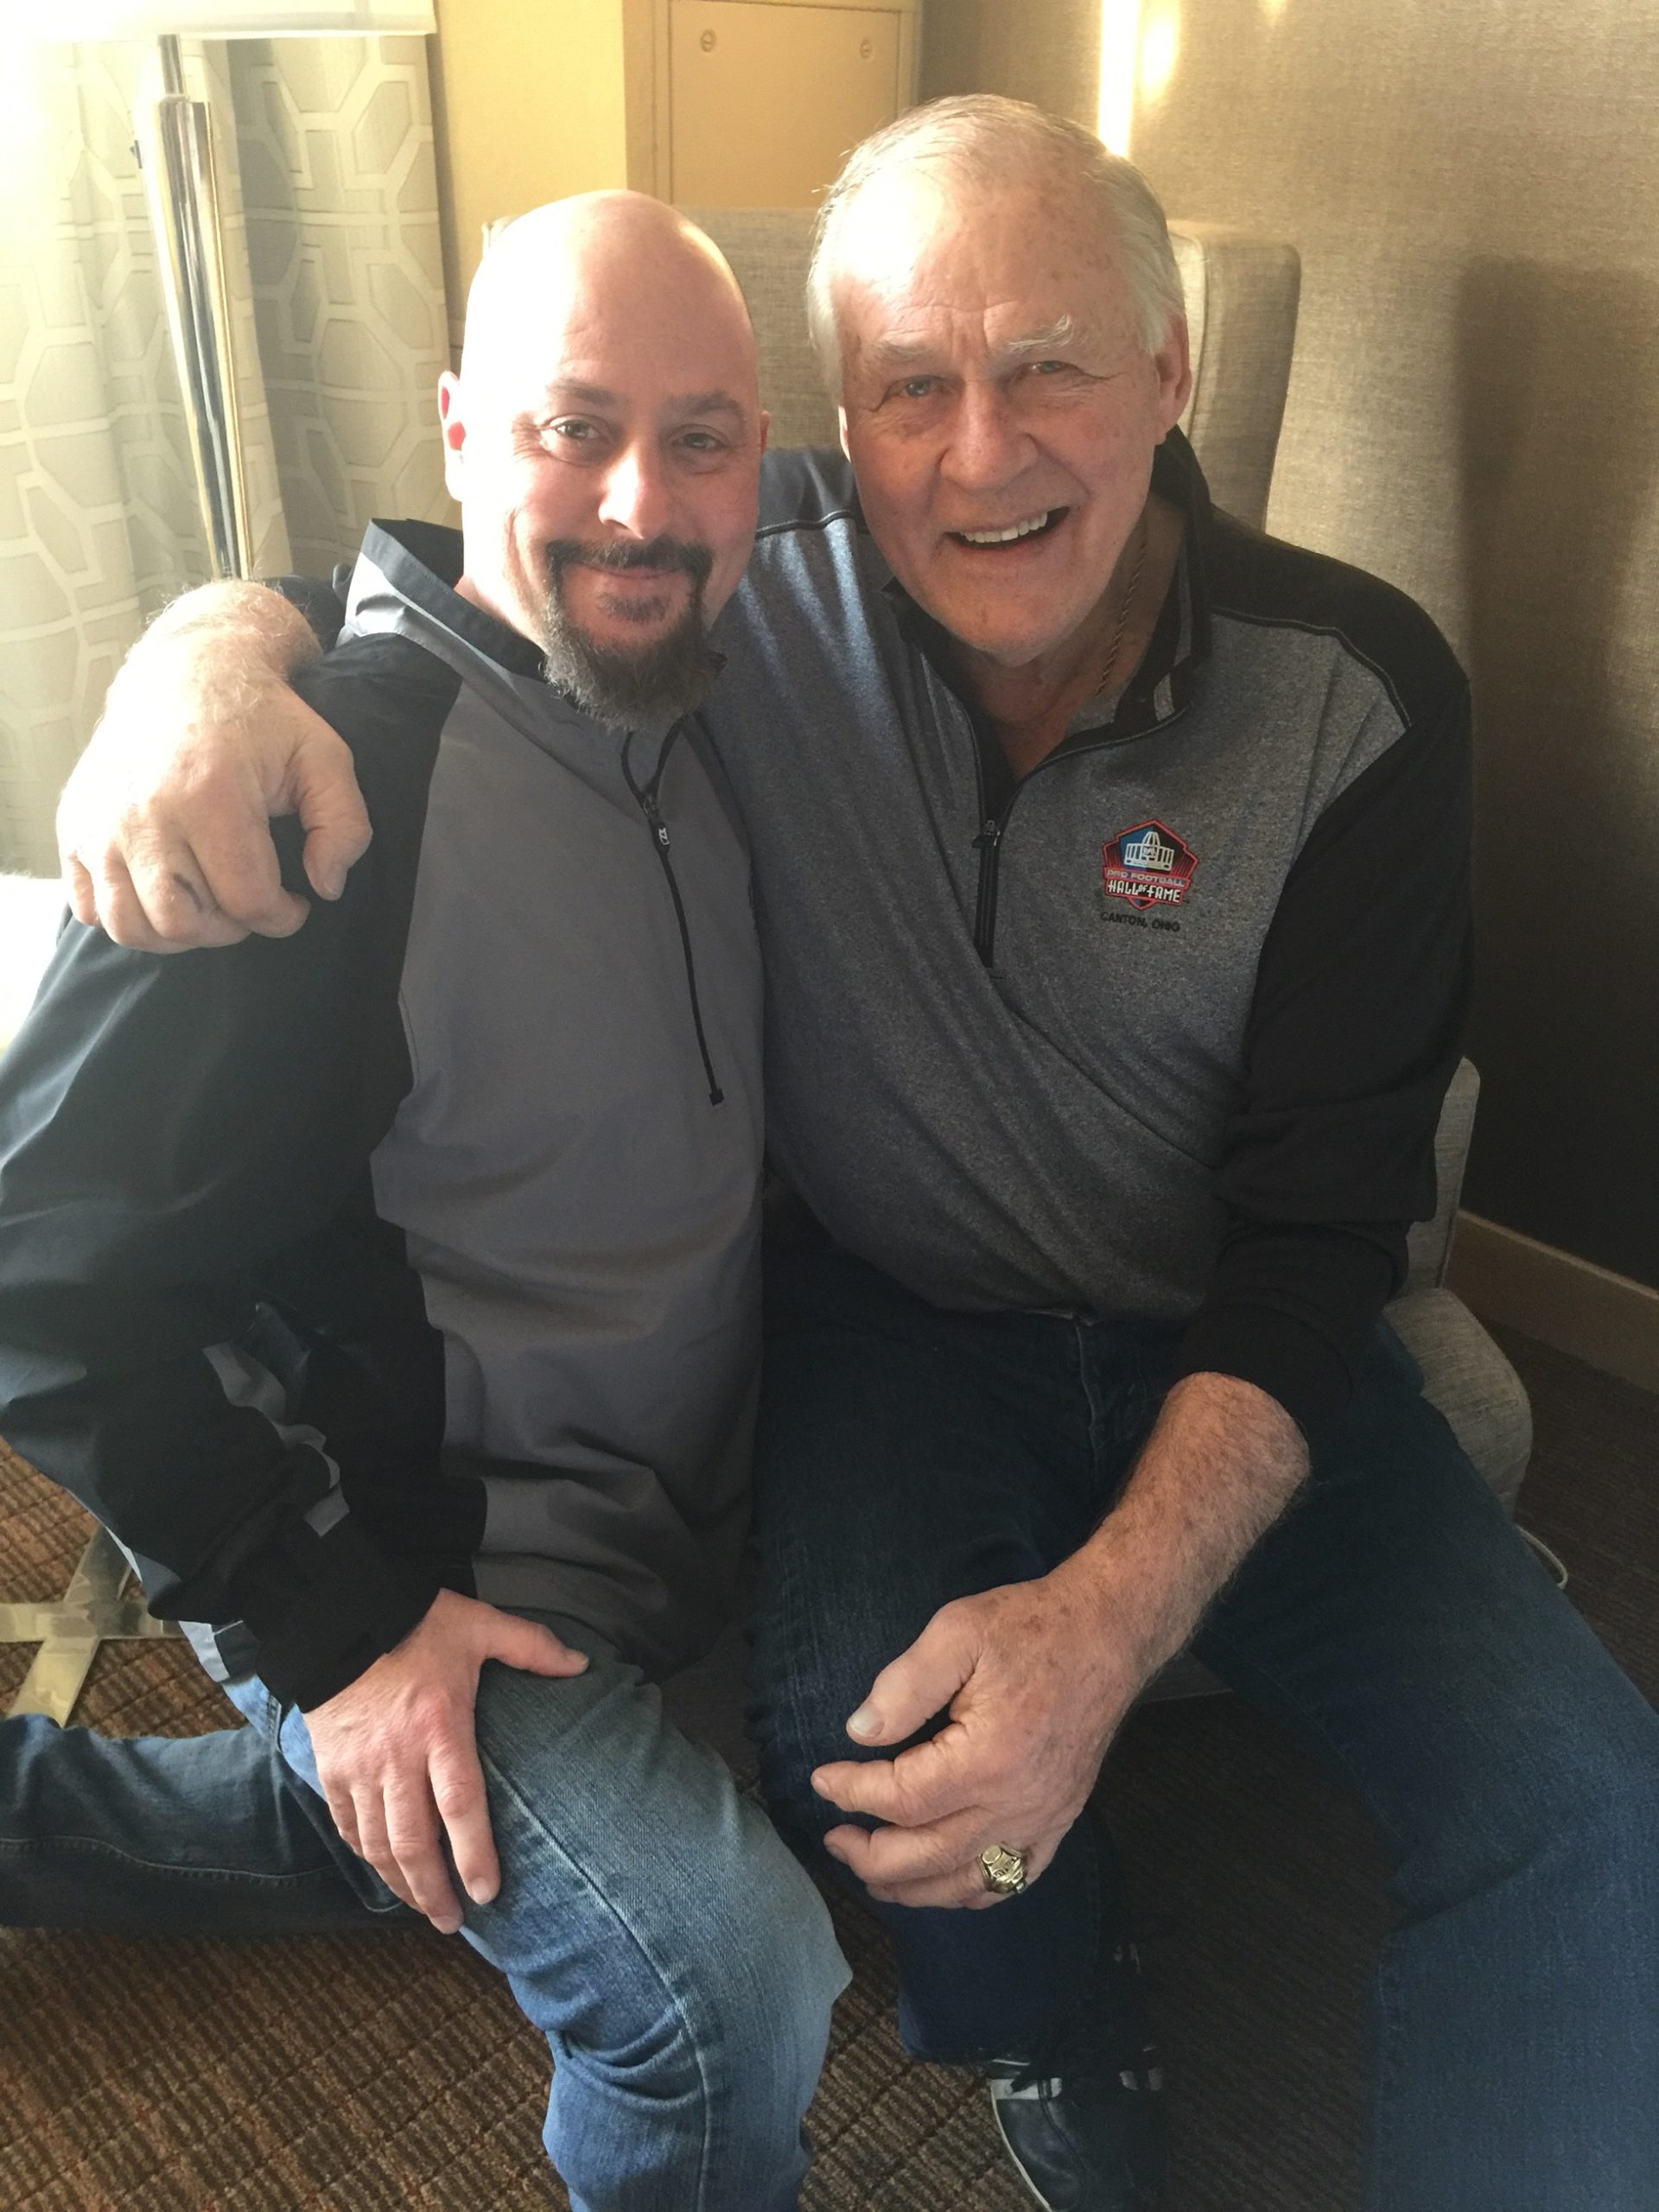
Community events featuring familiar faces such as Gilbert Brown or Eddie Lacy often create strong local engagement. Success may be reflected through attendance growth, media coverage, and positive brand sentiment rather than direct revenue.
Follow up engagement, including email signups or social follows after the event, also plays an important role in evaluating performance.
Tracking Sales, Leads, and Conversions
When campaigns are tied to promotions, product launches, or ticket sales, conversion tracking becomes essential. Promo code usage, form submissions, and direct sales during the campaign period help connect athlete involvement to business outcomes.
Not every campaign is designed for immediate sales, but when conversions are a goal, clear tracking ensures athlete marketing is evaluated with accuracy and transparency.
Media Exposure and Long Term Brand Value
Athlete marketing often generates earned media beyond owned channels. Press mentions, interviews, and social amplification contribute to brand credibility over time.
Even a single appearance can create lasting value if it leads to repeat coverage or strengthens brand positioning. Measuring media reach and sentiment helps brands understand the extended impact of athlete partnerships.
Using Performance Data to Improve Future Campaigns
The most valuable insights come after the campaign ends. Reviewing data allows brands to refine messaging, choose the right platforms, and identify which athlete profiles align best with specific goals.
For example, if a digital campaign with Tucker Kraft performs especially well on video based platforms, future campaigns can prioritize similar formats. Measurement turns athlete marketing into a repeatable, scalable strategy rather than a one time effort.
How Mayfield Sports Marketing Supports Campaign Success
At Mayfield Sports Marketing, we do more than connect brands with athletes. We help plan campaigns with clear objectives, align athlete selection with brand goals, and support performance evaluation from start to finish.
Our experience working with current and retired athletes allows us to recommend the right mix of influence, authenticity, and measurable impact. Whether your focus is community engagement, digital growth, or brand credibility, we help ensure every campaign delivers meaningful results.
Final Thoughts
Measuring athlete marketing success requires clarity, consistency, and context. When goals are defined, metrics are aligned, and insights are applied, athlete partnerships become powerful long term assets rather than short term promotions.
If you are planning an athlete marketing campaign and want results you can clearly measure and improve over time, Mayfield Sports Marketing is ready to help you execute with confidence.
Mark M. Mayfield is the founder and CEO of Mayfield Sports Marketing, a leading sports marketing agency specializing in athlete bookings, brand partnerships, and corporate speaking engagements. With 20+ years of experience and a career that began through a life-changing partnership with Packers legend Gilbert Brown, Mark has built a trusted reputation for connecting brands with iconic sports figures. His agency has worked with NFL, NBA, MLB, and Olympic athletes, delivering high-impact events and endorsements for companies like ESPN, MDA, and CitGo.